Wednesday, May 31, 2006

Mapping Terrorism Online

Based on two databases provided by the RAND Corporation, the MIPT Terrorism Knowledge Base has both an interactive and a static map showing terrorism incidents. The static map comes in PDF format and shows terrorism trends during 2005. The interactive map allows users to zoom into an area and display terrorism activity along with population densities, transportation densities, satellite imagery, location of power plants, etc. Clicking on a terrorist incident point brings up a detailed listing of incidents.

Unfortunately, there is no way to download the actual datasets for your own use, as they are proprietary to the RAND corporation.

via Cartography

Tuesday, May 30, 2006

Google Mashups Made Easier

'Mark a map location, add some text, send to friends.'

That's all it takes to use 'Pin in the map', a free service from Eden Development launched today which allows everyone to easily send a map link to their friends, with their own info attached. They can also use the service to add a professional location link to their business website.

Created by the author of Google Earth's popular 'Transparent Clouds' plugin, Pin in the map combines the phenomenal power of Google's mapping service with a foolproof three-step interface.

This makes it easier than ever before to pinpoint locations and to share them with contacts. The pins never expire and ensure that those with the link can find the pin whenever they need to.

Business owners can opt for a 'premium pin', allowing them to place a customized link directly on their web page showing their customers where to find them. Future versions of the software promise a premium pin service allowing business promotion on a site listing.

'Pin in the map was designed for the simple reason that we discovered we needed it,' said Eden Development's founder, Chris Parsons. 'Before this, we were forever printing out maps to write on, and or marking the exact location on a map in a paint program.

'After plenty of frustration, we thought, 'There must be a better way to do this!' And now there is.'

Try out the service at http://pininthemap.com

via eMediaWire

Wednesday, May 24, 2006

TrackStick GPS Data Logger

One of my favorite websites, ThinkGeek, is selling a nifty little GPS datalogger called the "TrackStick."

This small GPS gadget can easily be placed in a car, boat, land speeder, or just about any moving object and will record its own time, date, location, speed, direction and altitude. The recorded information can then be downloaded to your computer through the USB port and optionally integrated with Google Earth or Mapquest. This feature allows you to 'playback' the location points of the TrackStick and see a visual mapped history of its travels. There are no special software applications to buy and the raw data can be exported in RTF, XLS, HTML, or Google Earth KML formats.

via ThinkGeek

Monday, May 22, 2006

The Harley-Davidson® Ride Atlas of North America

The good folks at Rand McNally have issued a new map designed especially for motorcyclists. Here's the blurb from their website:
Rand McNally and Harley-Davidson are ready to hit the road together with the first-edition Harley-Davidson® Ride Atlas of North America. Designed especially for Harley® riders, the atlas comes loaded with motorcycle-friendly maps, rides, and on-the-road resources. Makes a great gift for any rider!

via Rand McNally
At first blush, this sounded like a great idea: a biker-friendly atlas. However the more I thought about it, the more I realized that this will probably end up being that gift that you receive but never use. I hate to sound sexist, but the vast majority of Harley owners are men-- do you really see one pulling over to the median to check a map?

Neither do I.

Satellite Tracking Google Mash-up

While there are many mash-up sites that link all kinds of datasets to the Google Maps API, the Real Time Satellite Tracking site authored by N2YO (his/her radio callsign) provides second-by-second tracking of Earth-orbiting satellites. The site defaults to a view that is centered on the International Space Station and the underlying Google map recenters itself about once a second to stay current.

The site provides links to hundreds of satellites and a sidebar not only gives each one's current position and speed, it tells you if is currently above your local horizon. You position is based on a query made to the IP2Location service, and may or may not be accurate, depending on your ISP.

I noticed that the AJAX interface uses a simple query based on the NORAD ID for each satellite, so I was able to map satellites that weren't on his list of links. For example, the lab where I work recently launched a constellation of 6 microsatellites. Since I knew the NORAD ID for each one, I was able to create a URL for each one.

The one improvement I'd like to see in this site is to be able to center the map on a location and then display the satellites that were currently above the horizon. Unfortunately, this is probably more than AJAX can handle, so I'll keep using http://www.heavens-above.com

Friday, May 19, 2006

Hic Sunt Dracones (Here Be Dragons),

In today's Times Online, Ben MacIntire wrote an excellent article about how GPS is changing the world. While I don't agree with everything in the article, he raises some interesting points. Here are two quotes...
"But above all, I resent [GPS] because [it is] gradually killing off maps, the charts that have revealed the changing contours of our world and minds since the birth of culture. English mapmakers once placed the phrase Hic sunt dracones, “Here be dragons”, on maps to mark the edges of the known world. [GIS] has slain what few dragons remained. With a GPS embedded in dashboard, wristwatch or mobile telephone, we will never be lost again."

"The paper map will soon die, and with it something central to human experience. There is a joy is not knowing exactly where you are. The electronic gizmo takes you from A to Z, but it does not show you the place you never knew about, off at the side of the map, the road lestraveleded. The joy of exploration lies in not knowing exactly where you are, or where you are going, in trying to match the visual world outside with the one-dimensional world represented by the map. Wherever you go now, the machine has got there first."

via Times Online

Wednesday, May 17, 2006

Microsoft Releases MapCruncher

MapCruncher brings mashups to a whole new level by allowing developers to import entire maps to supplement the existing road and aerial imagery with detailed, application-specific information. The possibilities are endless: bicycle maps, transit maps, national park maps, university maps, antique city maps, or whatever scale maps you personally find interesting.

MapCruncher makes it easy to publish maps overlaid on Virtual Earth. Once you get familar with the tool, it will take you about ten minutes to crunch a new map. Just find 5 to 10 corresponding landmarks on your map and on Virtual Earth, and MapCruncher will register your map to the global coordinate system, warp it to fit a Mercator projection, and generate a set of image tiles that can be seamlessly mashed up with VE's standard road or aerial imagery. It even makes a sample HTML page to show you how to use your mashed-up map.

MapCruncher accepts both drawing formats (PDF, WMF, EMF) and image formats (JPG, PNG, TIFF, GIF, BMP).

via Microsoft Research

Mapping Urban Sprawl

An unprecedented survey of urban sprawl in the continental United States is challenging conventional notions about development. The research, published in the May issue of the Quarterly Journal of Economics, offers a detailed view of how land use varies across the country and, for the first time, explains what may be causing the variation.

'There was a lot of talk about urban sprawl and there were no facts. We put this data set together so that we could get some facts,' said Matthew Turner, associate professor of economics at the University of Toronto.

Questions and opinions about urban sprawl and its causes have been around for years. But according to Turner, the opinions and policies arising from these debates are based largely on speculation.

To produce meaningful data, the researchers merged high-altitude photography from around 1976 with satellite images from 1992 -- the most recent images available. They divided the space into 8.7 billion grid cells, each representing 900 square meters (a little less than a quarter of an acre).

The scientists pinpointed development by measuring the percentage of impermeable cover, such as that created by buildings and concrete, producing a sprawl index. The higher the index, the more scattered a city. For example, among metropolitan areas with a population over one million, Atlanta has an index of 56 percent, while New York has an index of 20 percent.


via Discovery Channel

Mapping Language Usage

Dr. Huffman has classified the languages of the Ethnologue into broader groupings following Merritt Ruhlen’s A Guide to the World’s Languages (published 1987, 1991 by Stanford University Press), and has produced as series of maps of language phyla and families using this classified data and GMI’s World Language Mapping System and Seamless Digital Chart of the World geographic datas sets.
PDF versions of the maps available for download, as are Dr. Huffman’s data and ArcGIS project files.

via Global Mapping International

Tuesday, May 16, 2006

NGA to Use Microsoft Virtual Earth

A U.S. Department of Defense agency and Microsoft will collaborate to improve Microsoft’s Virtual Earth mapping program for military and non-military purposes, the Redmond, Wash., company announced Thursday.

Microsoft signed a letter of understanding with the National Geospatial-Intelligence Agency (NGA), which is a 'Department of Defense combat support agency,' the company said. Microsoft and NGA will use Virtual Earth, part of Microsoft’s Windows Live, for tasks such as guiding relief efforts for natural disasters. The program was used during Hurricane Katrina last year to direct first responders and government branches, Microsoft said.

Neither party specified the potential military applications of Virtual Earth or its application programming interfaces beyond 'national security efforts.'

via CIO

Monday, May 15, 2006

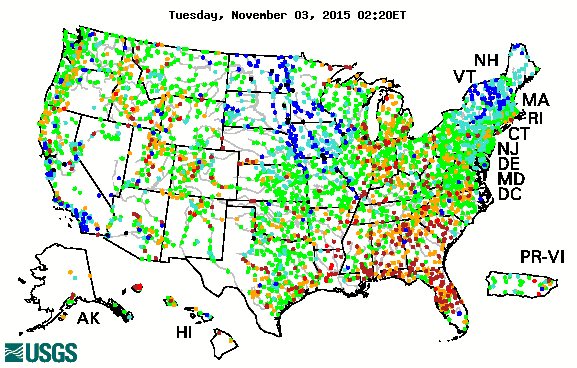
Real-time Map of USGS River Gauges

The USGS has added another excellent real-time mapping resource to their website. Areas in blue are wetter than at the same time last year, while drier areas are in red.

The map tracks short-term changes (over several hours) in rivers and streams. The general appearance of the map changes very little from one hour to the next, but individual sites may change rapidly in response to major rain events or to reservoir releases.


via USGS WaterWatch

Tuesday, May 02, 2006

2006 Survey of Geographic Literacy

The National Geographic Society recently sponsored a survey of 18 to 24 year-old Americans. While some of the questions in the survey have been criticized (such as asking which of 5 cities is the setting for the TV show CSI), then results are predictibably frightening.

Americans are far from alone in the world, but from the perspective of many young Americans, we might as well be. Most young adults between the ages of 18 and 24 demonstrate a limited understanding of the world, and they place insufficient importance on the basic geographic skills that might enhance their knowledge. They answered about half (54 percent) of the survey questions correctly. Only 37% of young Americans can find Iraq on a map—though U.S. troops have been there since 2003. Here are a few "highlights:"

  • 6 in 10 young Americans don't speak a foreign language fluently.
  • 20% of young Americans think Sudan is in Asia. (It's the largest country in Africa.)
  • 48% of young Americans believe the majority population in India is Muslim. (It's Hindu—by a landslide.)
  • Half of young Americans can't find New York on a map.

via National Geographic